
Summary of trading methods in the Forex market:
Are you getting ready to take your first steps in trading but still haven’t decided on a trading strategy? Do you want to learn about different types of Forex trading systems for beginners and professionals? This review will outline different types of systems to base your own trading strategy on. Each section will discuss the essence of the strategy with an example, entry/exit points, and risk levels.
The article covers the following topics:
- What is a Forex strategy? Definition of a Forex strategy
- How Forex Trading Strategies Really Work
- Basic Forex Trading Strategies for Beginners
- Advanced Forex Trading Strategies for Professionals
- Trading Strategies Summary
- Daily Forex Trading Strategy FAQ
What is a Forex strategy? Definition of a Forex strategy:
A Forex trading strategy is an algorithm that allows you to achieve your goals as quickly as possible with an optimal level of risk. The goal is usually to achieve a certain percentage of profit.
The trading system will help answer the following questions:
- What is the goal and how long does it take to achieve it? Based on this, the type of strategy chosen should match the time, frequency of signals and the user’s risk level.
- What are the main types of trading assets? What is their volatility?
- What time frame is chosen for analysis and which time frame is used when trading?
- What tools are used to search for signals? What analysis will be used: fundamental, technical or graphical? Which tools will give the main signal, which will give additional signals?
- What combination of signals is the basis for placing market or pending orders and exiting Forex market orders?
- What are the risk management rules? How is the volume of the first transaction calculated, as well as the volume of subsequent transactions in case of profit or loss? How are stop loss and take profit levels calculated? What is the maximum allowable loss?
- What is the algorithm for unforeseen situations?
Having a trading plan will help you react quickly to any changes. Not having a specific trading strategy will mean chaotic trading moves and wasting time.
How Forex Trading Strategies Really Work
How Forex Trading Strategies Work:
- Having a strategy means you know what actions to take in each situation to maximize profits or minimize possible losses.
- When you have a plan, you understand the end goal. You break it down into stages and test the effectiveness of the strategy at each stage. If you find that the plan is not working, rebuild the trading system.
- A systematic approach will give you confidence in your decisions. If you have an effective strategy, you can turn it into an automated trading system by asking a trading advisor.
Having a trading strategy also has emotional benefits. When you have a plan, you can execute it clearly without succumbing to emotions. For example, if the price has gone in a different direction after you have entered the trade, but your plan still has an acceptable loss. So you don’t have to close the trade in a panic. You don’t have to wait until the last minute hoping for the price to turn around – you just calmly follow your pre-planned strategy.
Basic Forex Strategies for Beginners:
Forex trading strategies for beginners are trading systems that have the following characteristics:
- Few indicators. The chart should not have too much information so as not to confuse the trader.
- Large time frames. Time frames from H1 are easier to navigate because you have more time to analyze.
- Minimal risk. Rare signals with relatively small profits but high activation rates.
- Accurate analysis of signals.
All the profitable strategies described below are basic. They need to be refined and the indicator parameters need to be adjusted for each specific asset and time frame.
Positional Trading
Position trading is a long-term strategy. This strategy is based on the wave theory, according to which the market develops in cycles: any growth is followed by a recession. The trader takes a long-term position, taking as much profit as possible from a single price increase or decrease, while ignoring local counter-trend corrections. The position is closed when the price reverses or moves sideways.
Strategy Description
Cryptocurrency and stock assets are best suited for position trading strategies. Crypto pairs tend to move in a narrow corridor, while cryptocurrencies and stock assets have no ceiling for growth and tend to be long-term trends. Timeframe: H4 and above.
Risk level
Medium. The main risk of this strategy is stop out. On long timeframes, the cost of a pip is much higher than on minute timeframes. Therefore, even a small correction can cost you. The trader must have enough margin to maintain the drawdown.
Rate of return
The profitability of a long-term investment is 15-50% per year.
Trading duration
Long-term trading. Trades are held in the market from a few days to a few weeks or months.
Entry/exit points
The two best scenarios for entering the market are to open a position when the market breaks out of a sideways trend or following a fundamental driver. For example, after the release of a quarterly or annual report. Good indicators for determining the trend are the Alligator, ADX, moving averages. Consider exiting the market based on the situation.
Example
Trading a long-term position in stocks. Before opening a position, you need to analyze the statistics for each industry. Explosive growth is recorded in biotechnology companies, but this market is at risk of a large decline. Technology stocks are doing well but are falling deeply in the context of a general market downturn. Retail and consumer stocks are the best choices for position trading strategies.
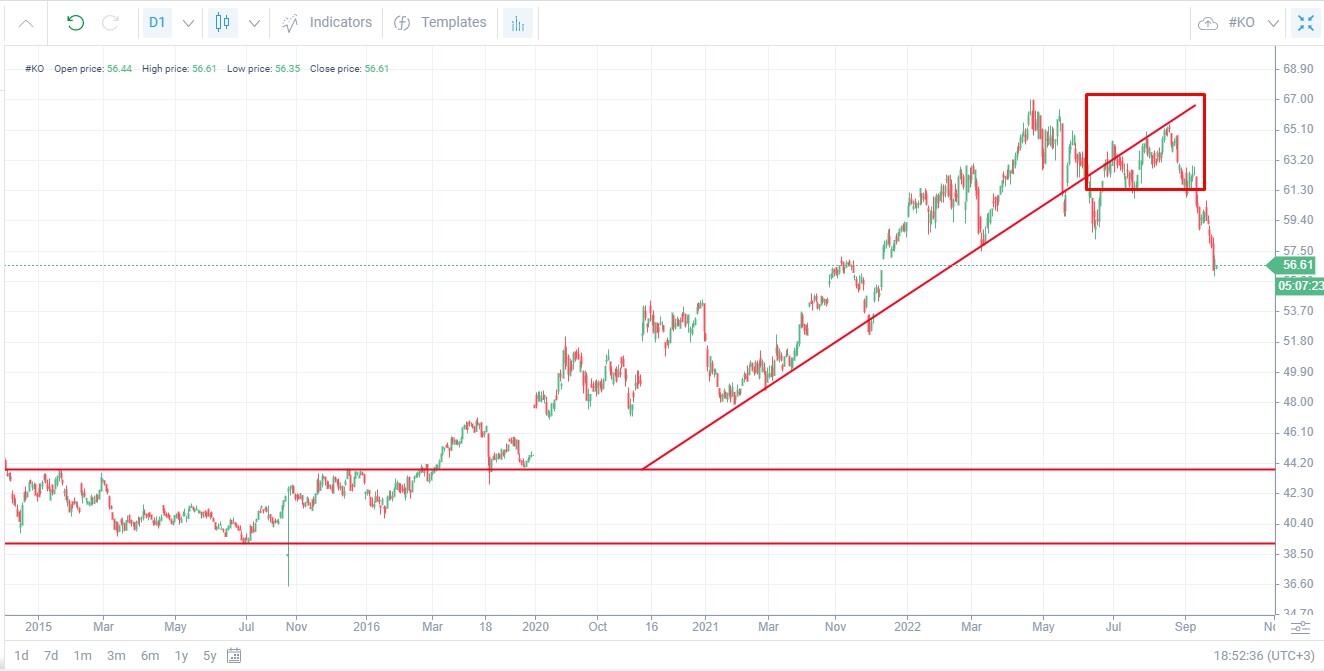
The screenshot above shows the long-term trend of Coca-Cola stock price. After exiting the sideways price corridor, the stock price increased. The duration of the local corrections was 1 month. The order was closed when the price consolidated near the trend line and when it moved from support to resistance. The potential profit over 9 months was $12/share or 23% per year.
Pros and cons
The advantage of position trading is that in the long run, strong price movements are longer and more stable. Market makers usually do not have enough capital to manipulate the market. After capturing the trend when exiting a sideways price or based on fundamentals, you can hold a position in the market with little or no supervision. On a daily basis, just check the chart for 5-7 minutes every few hours. Cons: less signals, lower profits than intraday swing trading systems
Trend Breakdown Strategy
Breakdown trading is a simple Forex strategy in which the main signal is usually a trend line breakout. Uptrend lines are drawn with lows, while downtrend lines are drawn with highs. Breakouts are confirmed by patterns and news that indicate a change in the main direction of price movement.
Strategy Description
The strategy is based on the idea of developing a wave market. Any long-term trend ends with a price consolidation or a change in price direction. If the price breaks the trend line and bounces back from it after a slight consolidation, it is a trend reversal. This is a strategy used in the medium term, the best timeframes are H1-H4.
Risk level
Below average. There is a risk of false breakouts, so it is important to monitor additional signals as well.
Profit Rate
Depends on the duration of the trend. In hourly timeframes, profits in 1-2 days can be up to 100-150 points. Long-term trends can generate profits of 300-400 points.
Trading time
Signals are relatively rare – in the hourly time frame, signals can appear once in 1-2 weeks. Trading time ranges from 12-15 hours to several days, so you need to take into account the fact that you will be charged swaps once and three times.
Entry/Exit Points
The next candle in the new trend direction after the breakout candle. There is a phenomenon of price accumulation near the trend line, which indicates that a temporary equilibrium has been established in the Forex market. For example, in an uptrend, buyers are not ready to buy the asset that has increased in price. Most see that the trend has stopped and start selling the asset at the top, so the price will start to fall. Confirmation signals: the formation of reversal patterns, the breakdown of key resistance/support levels.
Example
The goal is to create a trend line and wait for a breakout of this line after receiving confirmation from other tools. It is important to distinguish a price correction from a trend reversal.
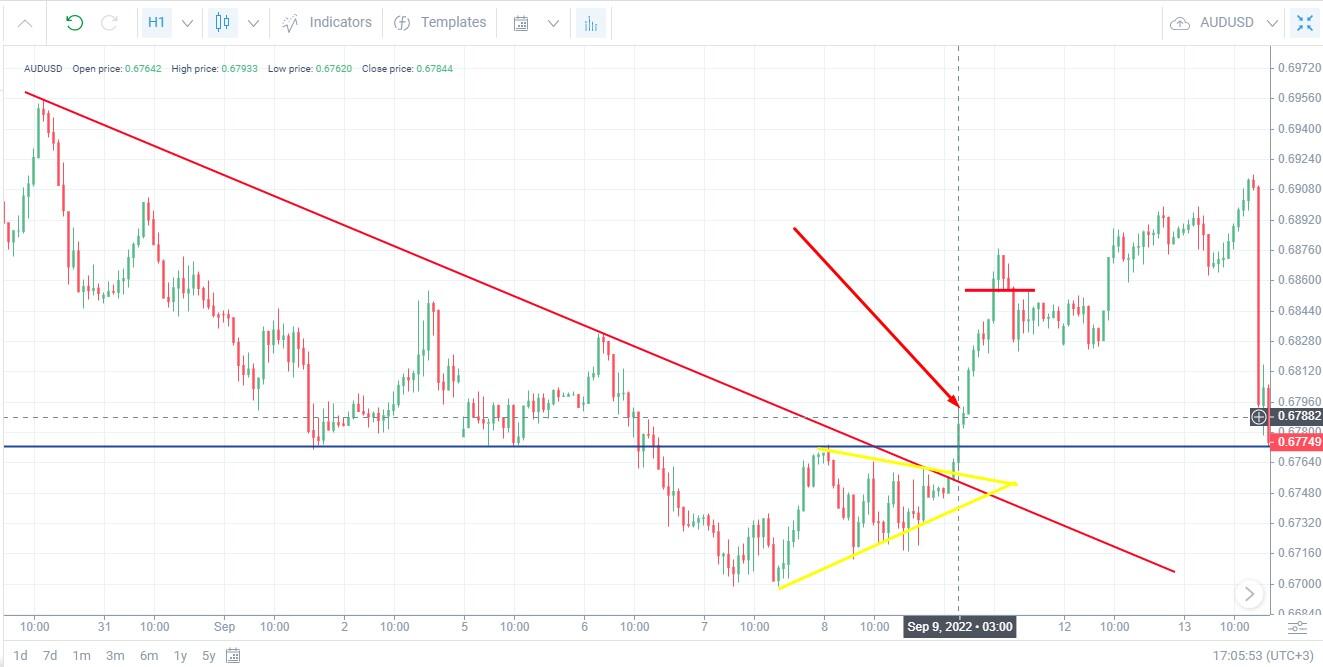
A strong downtrend is visible on the hourly timeframe of the AUD/USD pair, which allows us to draw a trend line. The line is drawn based on the extreme peaks to reduce the possibility of a false breakout (if a breakout occurs, the trend line moves). The screenshot above shows that the line is created using the first and fourth peaks.
At the end of a trend, volatility increases and the price begins a temporary correction. We can see the formation of a triangle pattern, the first zone is decreasing. The edges of this triangle are sometimes broken only by candlesticks, which indicates the weakness of the sellers – a preliminary signal. A relatively clear horizontal resistance level also appears.
The price breaks the upper edge of the triangle, followed by the trend line. As soon as the price breaks through the resistance level (confirmed three times), we open an order on the next candlestick. Then we close the order after two consecutive reversal candles appear (forming the Three Black Crows pattern). The profit with the minimum risk is 70 points.
Advantages and disadvantages
Suitable for beginners in trading, who have basic pattern trading skills and know how to build trend lines correctly. The advantage of this strategy is that there is time for analysis on long time frames, late entry after a trend breakout is not a mistake. The disadvantage is that the new trend can turn into a deep correction, so it is recommended to check the chart at least once an hour.
Swing Trading
Swing trading is a Forex trading strategy that involves profiting from rollbacks (drops). This strategy is based on the idea that local corrections can be applied to maximize profits. This trading method focuses on using rollbacks (corrective moves) that occur during the formation of a trend.
Strategy Description
One of the trading options for this system is to open a position at the end of the correction and close it when a new correction begins. The optimal time frame is from H1-H4. In short periods, the trend is less stable, so this strategy is rarely used in swing trading.
Risk level
Medium. If a strong trend is found, the risk of loss is relatively low, you need to close positions in time at the beginning of a rollback. But the trend is not always stable, the signal interpreted as the resumption of the trend may not be correct and the correction will continue.
Profit rate
Depends on the type of swing trading strategy and the time frame. In the hourly time frame, when trading with the trend, the profit per transaction usually falls to 80-100 points.
Trading time
Swing trading can be used both in intraday and long-term strategies, depending on the selected time frame. In the H1 timeframe, you can catch corrections with a depth of 5-7 candles and make a profit within a day. In the H4 timeframe, swing trading can be transformed into a long-term trading strategy with a trading duration of up to several days.
Entry/Exit Points
There is an uptrend in the market in which there are corrections to the downside. Traders can use them in the following ways:
- Open an order at the end of the correction in the direction of the trend. For example, you missed the start of the trend and you need to find an entry at the best price.
- Open an order at the bottom of the correction in the direction of the trend, close the order at the extreme point. Wait for the next correction, re-open the transaction at the end of the correction.
- Increase the volume of the position at the end of each correction.
- Alternately reverse the trade in the direction of the trend and in the direction of the correction.
Closing orders: 50% at the beginning of the correction (back to the last extreme point), the remaining 50% – with a trailing stop.
Indicators: trend tools with confirming oscillators to find the trend. Reversal patterns, resistance and support levels, Fibonacci levels.
Example
The goal is to find the trend in the hourly time frame. In the chart below, there is a horizontal resistance level following a downtrend.
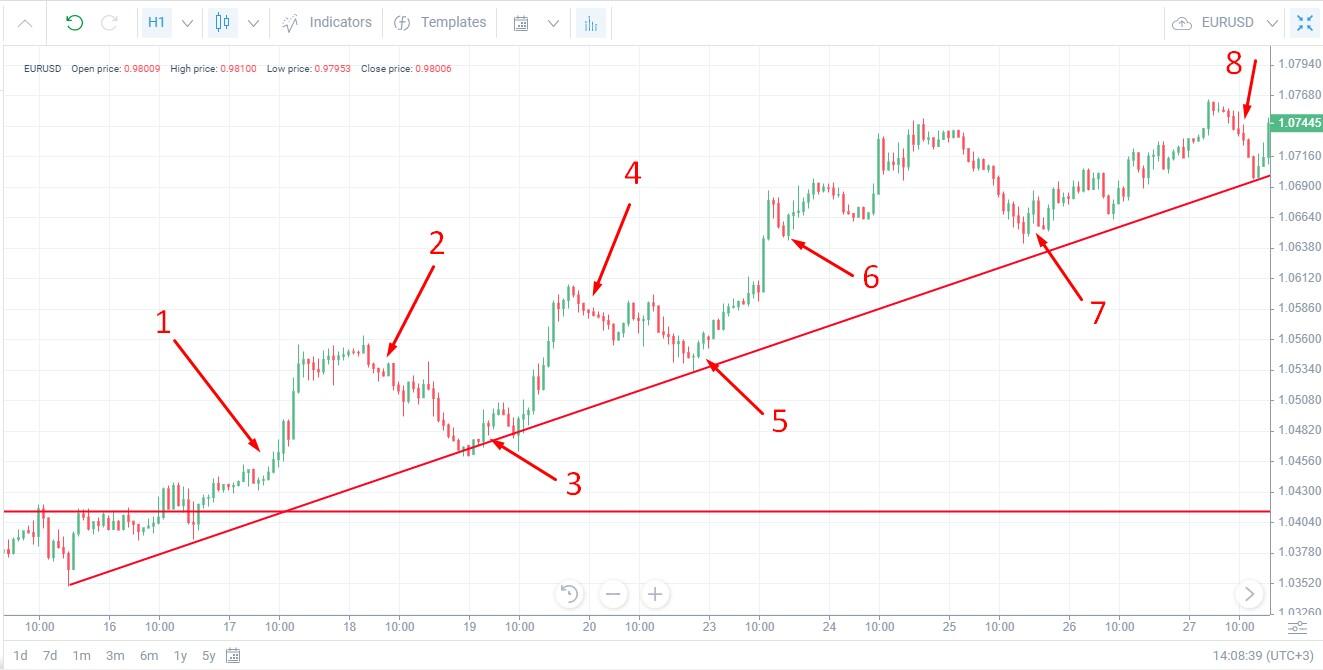
- After the resistance level is broken and a rebound from it takes place, a series of bullish candles appear. This is the beginning of a trend, open a buy position.
- The first strong reversal – three consecutive bearish candles – close the order.
- The price reverses to the upside, allowing to draw a trend line. Open a buy position.
- Three bearish candles – close the order.
- The price rebounds from the trend line and several bullish candles – open a buy position.
- Three bearish candles – close the order. Despite the fact that there is no correction, it is better not to risk it – wait for the next rollback.
- The price does not touch the trend line, but a reversal pattern appears – you can take a risk when opening a position (weak signal).
- Three bearish candles – close the order.
The profit of each order is 80-100 points, but swap fees need to be calculated.
Advantages and Disadvantages
Advantages of Forex Strategies:
- More Profit. Unlike trend trading, traders make more money when trading with a swing trading strategy. For example, a trend trader makes 100 pips when closing a position. A swing trader will make 50 pips following the trend and close the position when the price starts to correct. When the price moves back 15 pips, the swing trader opens the position again. Their profit is now 50 + 65 = 115 points.
- Less Risk. The position trader waits for the correction and protects the trade with a stop order. If the stop loss is triggered, the loss will be equal to the depth of the correction. A swing trader will close the position when the price starts to correct. And if the rollback becomes a new trend, the swing trader will lose nothing.
The downside to this strategy is that you need to constantly monitor the chart to find the optimal start and end points for the correction. Price corrections are not always as ideal as in theory and can be sideways.
